This blog post discusses the integration of Coding Agent with Chrome DevTools Manipulate Chrome Protocol (MCP) for debugging web sessions. It highlights how this feature improves debugging efficiency by enabling automated code analysis and providing context-aware suggestions. The article emphasizes the potential to enhance developer productivity and streamline debugging processes using this tool.
# Let your Coding Agent debug your browser session with Chrome DevTools MCP | Blog | Chrome for Developers
[Skip to main content](https://developer.chrome.com/blog/chrome-devtools-mcp-debug-your-browser-session#main-content)
[](https://developer.chrome.com/)
[Docs](https://developer.chrome.com/docs)
* Build with Chrome
* Learn how Chrome works, participate in origin trials, and build with Chrome everywhere.
* [Web Platform](https://developer.chrome.com/docs/web-platform)
* [Capabilities](https://developer.chrome.com/docs/capabilities)
* [ChromeDriver](https://developer.chrome.com/docs/chromedriver)
* [Extensions](https://developer.chrome.com/docs/extensions)
* [Chrome Web Store](https://developer.chrome.com/docs/webstore)
* [Chromium](https://developer.chrome.com/docs/chromium)
* [Web on Android](https://developer.chrome.com/docs/android)
* [Origin trials](https://developer.chrome.com/origintrials/)
* [Release notes](https://developer.chrome.com/release-notes)
* Productivity
* Create the best experience for your users with the web's best tools.
* [DevTools](https://developer.chrome.com/docs/devtools)
* [Lighthouse](https://developer.chrome.com/docs/lighthouse)
* [Chrome UX Report](https://developer.chrome.com/docs/crux)
* [Accessibility](https://developer.chrome.com/docs/accessibility)
* Get things done quicker and neater, with our ready-made libraries.
* [Workbox](https://developer.chrome.com/docs/workbox)
* [Puppeteer](https://developer.chrome.com/docs/puppeteer)
* Experience
* Design a beautiful and performant web with Chrome.
* [AI](https://developer.chrome.com/docs/ai)
* [Performance](https://developer.chrome.com/docs/performance)
* [CSS and UI](https://developer.chrome.com/docs/css-ui)
* [Identity](https://developer.chrome.com/docs/identity)
* [Payments](https://developer.chrome.com/docs/payments)
* [Privacy and security](https://developer.chrome.com/docs/privacy-security)
* Resources
* More from Chrome and Google.
* [All documentation](https://developer.chrome.com/docs)
* [Baseline](https://web.dev/baseline)
* [web.dev](https://web.dev/)
* [PageSpeed Insights audit](https://pagespeed.web.dev/)
* [The Privacy Sandbox](https://developers.google.com/privacy-sandbox)
* [Isolated Web Apps (IWA)](https://developer.chrome.com/docs/iwa)
[Case studies](https://developer.chrome.com/case-studies)[Blog](https://developer.chrome.com/blog)[New in Chrome](https://developer.chrome.com/new)More
/
* [English](https://developer.chrome.com/blog/chrome-devtools-mcp-debug-your-browser-session)
* [Deutsch](https://developer.chrome.com/blog/chrome-devtools-mcp-debug-your-browser-session?hl=de)
* [Español – América Latina](https://developer.chrome.com/blog/chrome-devtools-mcp-debug-your-browser-session?hl=es-419)
* [Français](https://developer.chrome.com/blog/chrome-devtools-mcp-debug-your-browser-session?hl=fr)
* [Indonesia](https://developer.chrome.com/blog/chrome-devtools-mcp-debug-your-browser-session?hl=id)
* [Italiano](https://developer.chrome.com/blog/chrome-devtools-mcp-debug-your-browser-session?hl=it)
* [Nederlands](https://developer.chrome.com/blog/chrome-devtools-mcp-debug-your-browser-session?hl=nl)
* [Polski](https://developer.chrome.com/blog/chrome-devtools-mcp-debug-your-browser-session?hl=pl)
* [Português – Brasil](https://developer.chrome.com/blog/chrome-devtools-mcp-debug-your-browser-session?hl=pt-br)
* [Tiếng Việt](https://developer.chrome.com/blog/chrome-devtools-mcp-debug-your-browser-session?hl=vi)
* [Türkçe](https://developer.chrome.com/blog/chrome-devtools-mcp-debug-your-browser-session?hl=tr)
* [Русский](https://developer.chrome.com/blog/chrome-devtools-mcp-debug-your-browser-session?hl=ru)
* [עברית](https://developer.chrome.com/blog/chrome-devtools-mcp-debug-your-browser-session?hl=he)
* [العربيّة](https://developer.chrome.com/blog/chrome-devtools-mcp-debug-your-browser-session?hl=ar)
* [فارسی](https://developer.chrome.com/blog/chrome-devtools-mcp-debug-your-browser-session?hl=fa)
* [हिंदी](https://developer.chrome.com/blog/chrome-devtools-mcp-debug-your-browser-session?hl=hi)
* [বাংলা](https://developer.chrome.com/blog/chrome-devtools-mcp-debug-your-browser-session?hl=bn)
* [ภาษาไทย](https://developer.chrome.com/blog/chrome-devtools-mcp-debug-your-browser-session?hl=th)
* [中文 – 简体](https://developer.chrome.com/blog/chrome-devtools-mcp-debug-your-browser-session?hl=zh-cn)
* [中文 – 繁體](https://developer.chrome.com/blog/chrome-devtools-mcp-debug-your-browser-session?hl=zh-tw)
* [日本語](https://developer.chrome.com/blog/chrome-devtools-mcp-debug-your-browser-session?hl=ja)
* [한국어](https://developer.chrome.com/blog/chrome-devtools-mcp-debug-your-browser-session?hl=ko)
[Sign in](https://developer.chrome.com/_d/signin?continue=https%3A%2F%2Fdeveloper.chrome.com%2Fblog%2Fchrome-devtools-mcp-debug-your-browser-session&prompt=select_account)
* [Blog](https://developer.chrome.com/blog)
[](https://developer.chrome.com/)
* [Docs](https://developer.chrome.com/docs)
* More
* [Case studies](https://developer.chrome.com/case-studies)
* [Blog](https://developer.chrome.com/blog)
* [New in Chrome](https://developer.chrome.com/new)
* Build with Chrome
* [Web Platform](https://developer.chrome.com/docs/web-platform)
* [Capabilities](https://developer.chrome.com/docs/capabilities)
* [ChromeDriver](https://developer.chrome.com/docs/chromedriver)
* [Extensions](https://developer.chrome.com/docs/extensions)
* [Chrome Web Store](https://developer.chrome.com/docs/webstore)
* [Chromium](https://developer.chrome.com/docs/chromium)
* [Web on Android](https://developer.chrome.com/docs/android)
* [Origin trials](https://developer.chrome.com/origintrials/)
* [Release notes](https://developer.chrome.com/release-notes)
* Productivity
* [DevTools](https://developer.chrome.com/docs/devtools)
* [Lighthouse](https://developer.chrome.com/docs/lighthouse)
* [Chrome UX Report](https://developer.chrome.com/docs/crux)
* [Accessibility](https://developer.chrome.com/docs/accessibility)
* [Workbox](https://developer.chrome.com/docs/workbox)
* [Puppeteer](https://developer.chrome.com/docs/puppeteer)
* Experience
* [AI](https://developer.chrome.com/docs/ai)
* [Performance](https://developer.chrome.com/docs/performance)
* [CSS and UI](https://developer.chrome.com/docs/css-ui)
* [Identity](https://developer.chrome.com/docs/identity)
* [Payments](https://developer.chrome.com/docs/payments)
* [Privacy and security](https://developer.chrome.com/docs/privacy-security)
* Resources
* [All documentation](https://developer.chrome.com/docs)
* [Baseline](https://web.dev/baseline)
* [web.dev](https://web.dev/)
* [PageSpeed Insights audit](https://pagespeed.web.dev/)
* [The Privacy Sandbox](https://developers.google.com/privacy-sandbox)
* [Isolated Web Apps (IWA)](https://developer.chrome.com/docs/iwa)
* On this page
* [How it works](https://developer.chrome.com/blog/chrome-devtools-mcp-debug-your-browser-session#how_it_works)
* [Get started](https://developer.chrome.com/blog/chrome-devtools-mcp-debug-your-browser-session#get_started)
* [Step 1: Set up remote debugging in Chrome](https://developer.chrome.com/blog/chrome-devtools-mcp-debug-your-browser-session#step_1_set_up_remote_debugging_in_chrome)
* [Step 2: Configure Chrome DevTools MCP server to automatically connect to a running Chrome Instance](https://developer.chrome.com/blog/chrome-devtools-mcp-debug-your-browser-session#step_2_configure_chrome_devtools_mcp_server_to_automatically_connect_to_a_running_chrome_instance)
* [Step 3: Test your setup](https://developer.chrome.com/blog/chrome-devtools-mcp-debug-your-browser-session#step_3_test_your_setup)
* [Let your coding agent take over your debugging session](https://developer.chrome.com/blog/chrome-devtools-mcp-debug-your-browser-session#let_your_coding_agent_take_over_your_debugging_session)
* [Chrome for Developers](https://developer.chrome.com/)
* [Blog](https://developer.chrome.com/blog)
Was this helpful?
# Let your Coding Agent debug your browser session with Chrome Dev Tools MCP Stay organized with collections Save and categorize content based on your preferences.
* On this page
* [How it works](https://developer.chrome.com/blog/chrome-devtools-mcp-debug-your-browser-session#how_it_works)
* [Get started](https://developer.chrome.com/blog/chrome-devtools-mcp-debug-your-browser-session#get_started)
* [Step 1: Set up remote debugging in Chrome](https://developer.chrome.com/blog/chrome-devtools-mcp-debug-your-browser-session#step_1_set_up_remote_debugging_in_chrome)
* [Step 2: Configure Chrome DevTools MCP server to automatically connect to a running Chrome Instance](https://developer.chrome.com/blog/chrome-devtools-mcp-debug-your-browser-session#step_2_configure_chrome_devtools_mcp_server_to_automatically_connect_to_a_running_chrome_instance)
* [Step 3: Test your setup](https://developer.chrome.com/blog/chrome-devtools-mcp-debug-your-browser-session#step_3_test_your_setup)
* [Let your coding agent take over your debugging session](https://developer.chrome.com/blog/chrome-devtools-mcp-debug-your-browser-session#let_your_coding_agent_take_over_your_debugging_session)

Sebastian Benz
[](https://github.com/sebastianbenz)[](https://mastodon.cloud/@sebabenz)[](https://bsky.app/profile/sebabenz.bsky.social)

Alex Rudenko
[](https://twitter.com/orkon)[](https://github.com/orkon)
Published: December 11, 2025
We shipped an enhancement to the Chrome DevTools MCP server that many of our users have been asking for: the ability for coding agents to directly connect to active browser sessions.
With this enhancement, coding agents are able to:
1. **Re-use an existing browser session:** Imagine you want your coding agent to fix an issue that is gated behind a sign-in. Your coding agent can now directly access your current browsing session not requiring an additional sign-in.
2. **Access active debugging sessions:** Coding agents can now access an active debugging session in the DevTools UI. For example, when you discover a failing network request in the Chrome DevTools network panel, select the request and ask your coding agent to investigate it. The same also works with elements selected in the Elements panel. We are excited about this new ability to seamlessly transition between manual and AI-assisted debugging.
See it in action:
The auto connection feature is an addition to the existing ways for the Chrome DevTools MCP to connect to a Chrome instance. Note that you can still:
* Run Chrome with a Chrome DevTools MCP server-specific user profile (current default).
* Connect to a running Chrome instance with a remote debug port.
* Run multiple Chrome instances in isolation with each instance running in a temporary profile.
## How it works
We've added a new feature to Chrome M144 (currently in Beta) that allows the Chrome DevTools MCP server to request a remote debugging connection. This new flow builds on top of the [existing remote debugging capabilities of Chrome](https://developer.chrome.com/docs/devtools/remote-debugging/local-server). By default, remote debugging connections are disabled in Chrome. Developers have to explicitly enable the feature first by going to `chrome://inspect#remote-debugging`.
When the Chrome DevTools MCP server is configured with the `--autoConnect` option, the MCP server will connect to an active Chrome instance and request a remote debugging session. To avoid misuse by malicious actors, every time the Chrome DevTools MCP server requests a remote debugging session, Chrome will show a dialog to the user and ask for their permission to allow the remote debugging session. In addition to that, while a debugging session is active, Chrome displays the "Chrome is being controlled by automated test software" banner at the top.
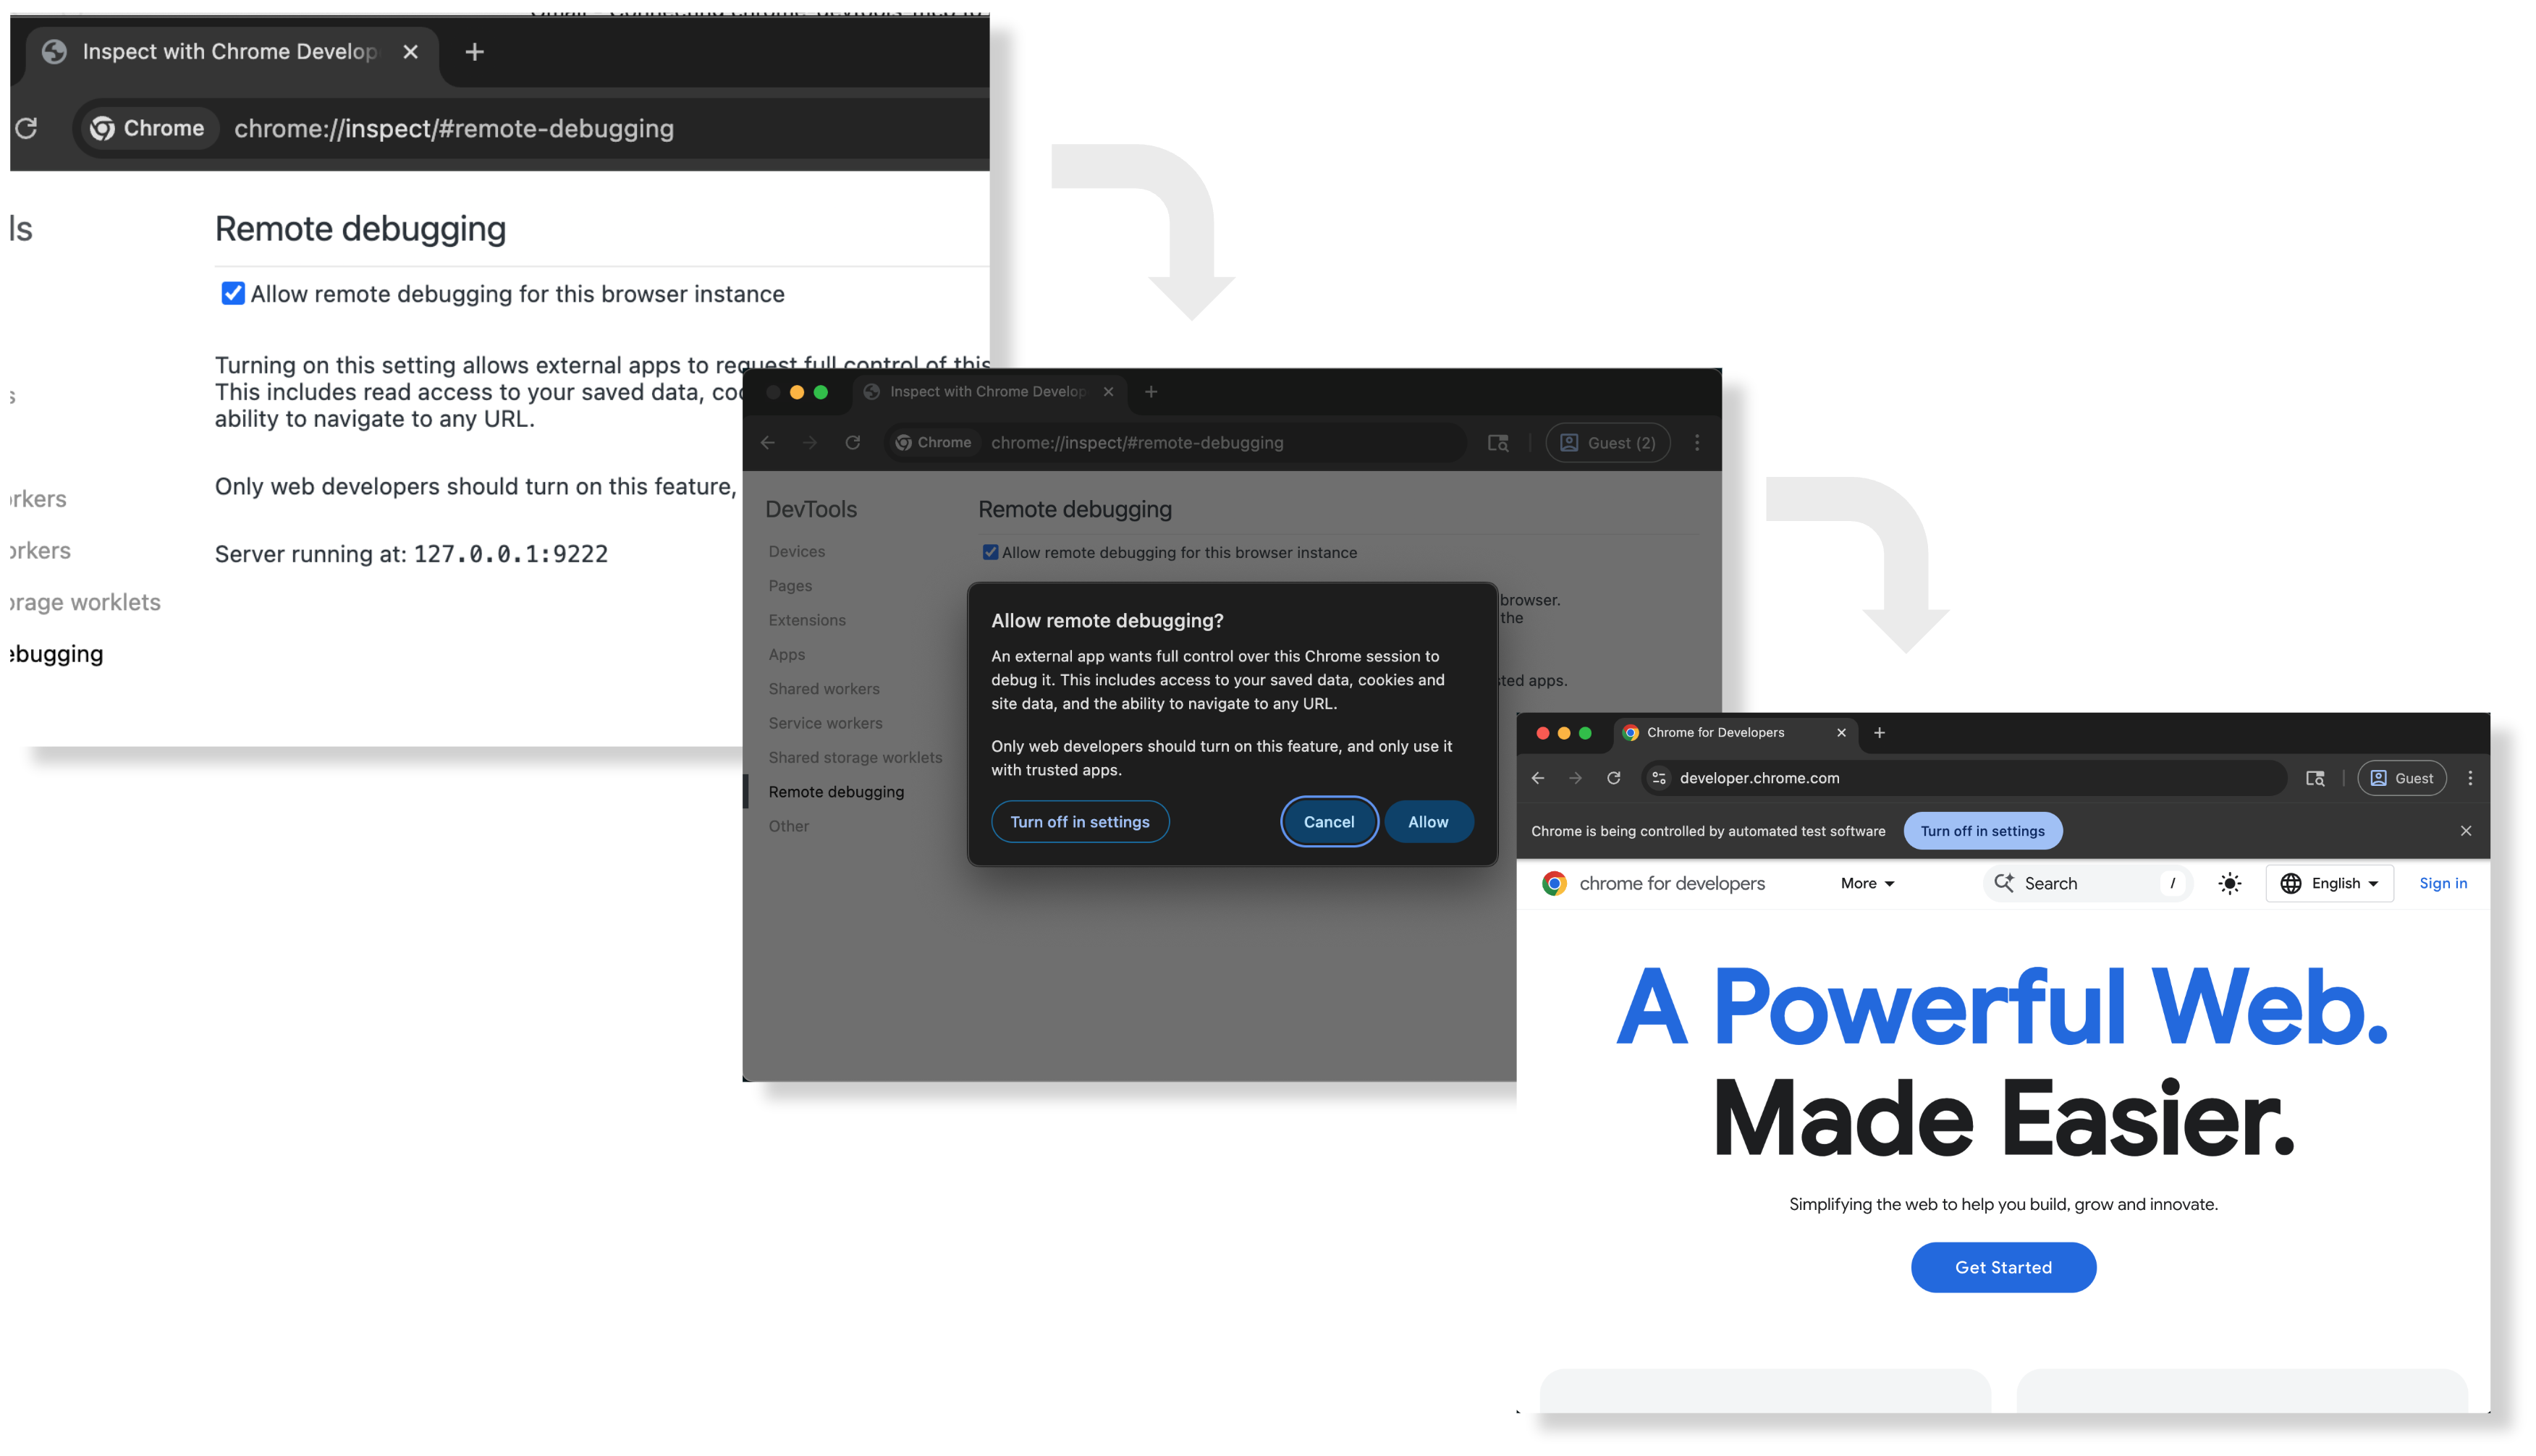
The new remote debugging flow and UI in Chrome.
## Get started
To use the new remote debugging capabilities. You have to first enable remote debugging in Chrome and then configure the Chrome DevTools MCP server to use the new auto connection feature.
### Step 1: Set up remote debugging in Chrome
In Chrome (>=144), do the following to set up remote debugging:
1. Navigate to `chrome://inspect/#remote-debugging` to enable remote debugging.
2. Follow the dialog UI to allow or disallow incoming debugging connections.
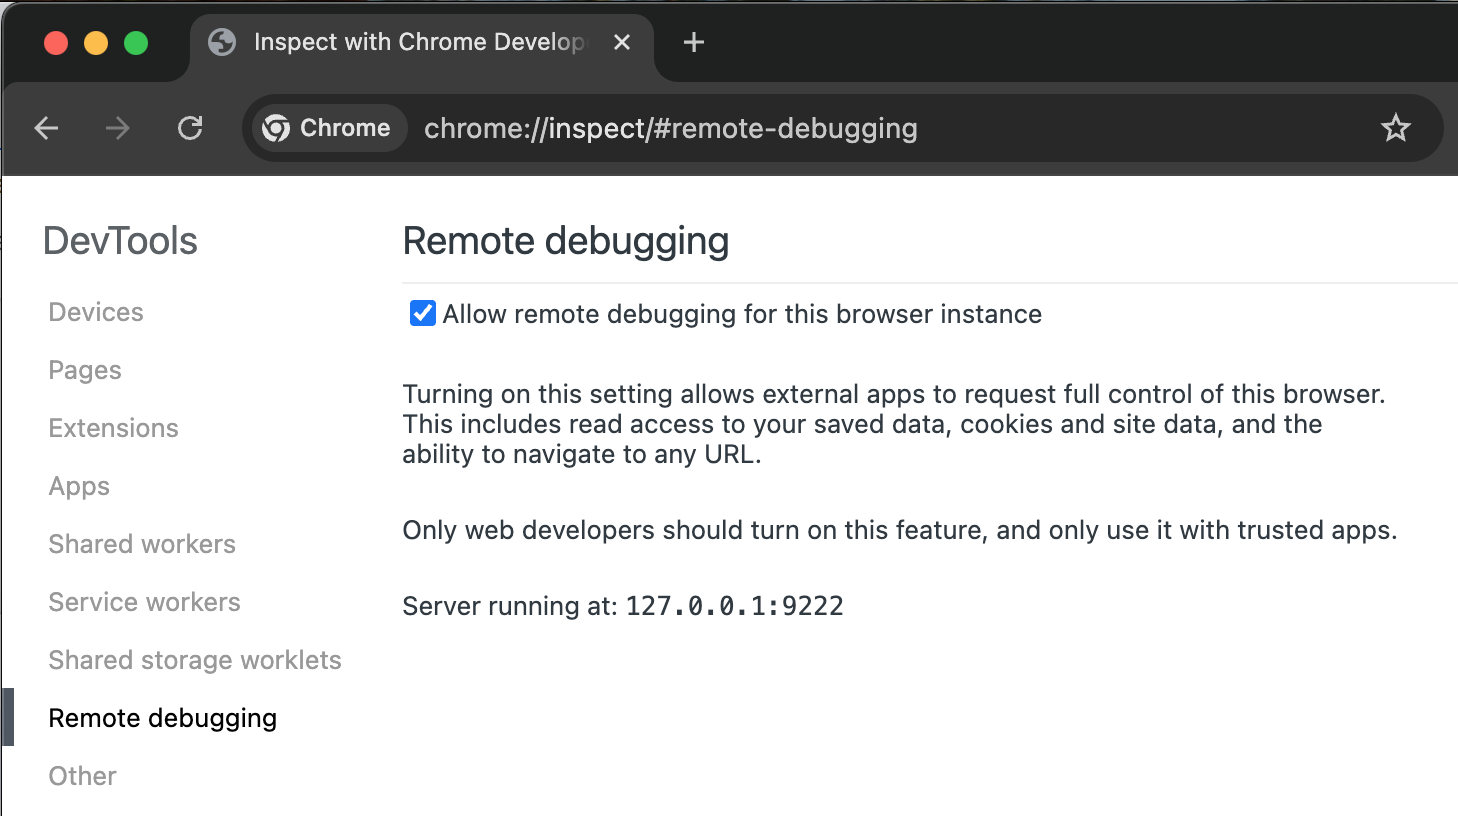
Remote debugging needs to be enabled, before clients can request a remote debugging connection.
### Step 2: Configure Chrome DevTools MCP server to automatically connect to a running Chrome Instance
To connect the `chrome-devtools-mcp` server to the running Chrome instance, use `--autoConnect` command line argument for the MCP server set.
The following code snippet is an example configuration for gemini-cli:
```
{
"mcpServers": {
"chrome-devtools": {
"command": "npx",
"args": [
"chrome-devtools-mcp@latest",
"--autoConnect",
"--channel=beta"
]
}
}
}
```
**Note:** you have to specify `--channel=beta` until Chrome M144 has reached the stable channel.
### Step 3: Test your setup
Now open gemini-cli and run the following prompt:
```
Check the performance of https://developers.chrome.com
```
**Note:** The `autoConnect` option requires the user to start Chrome.
The Chrome DevTools MCP server will try to connect to your running Chrome instance. It shows a dialog asking for user permission:
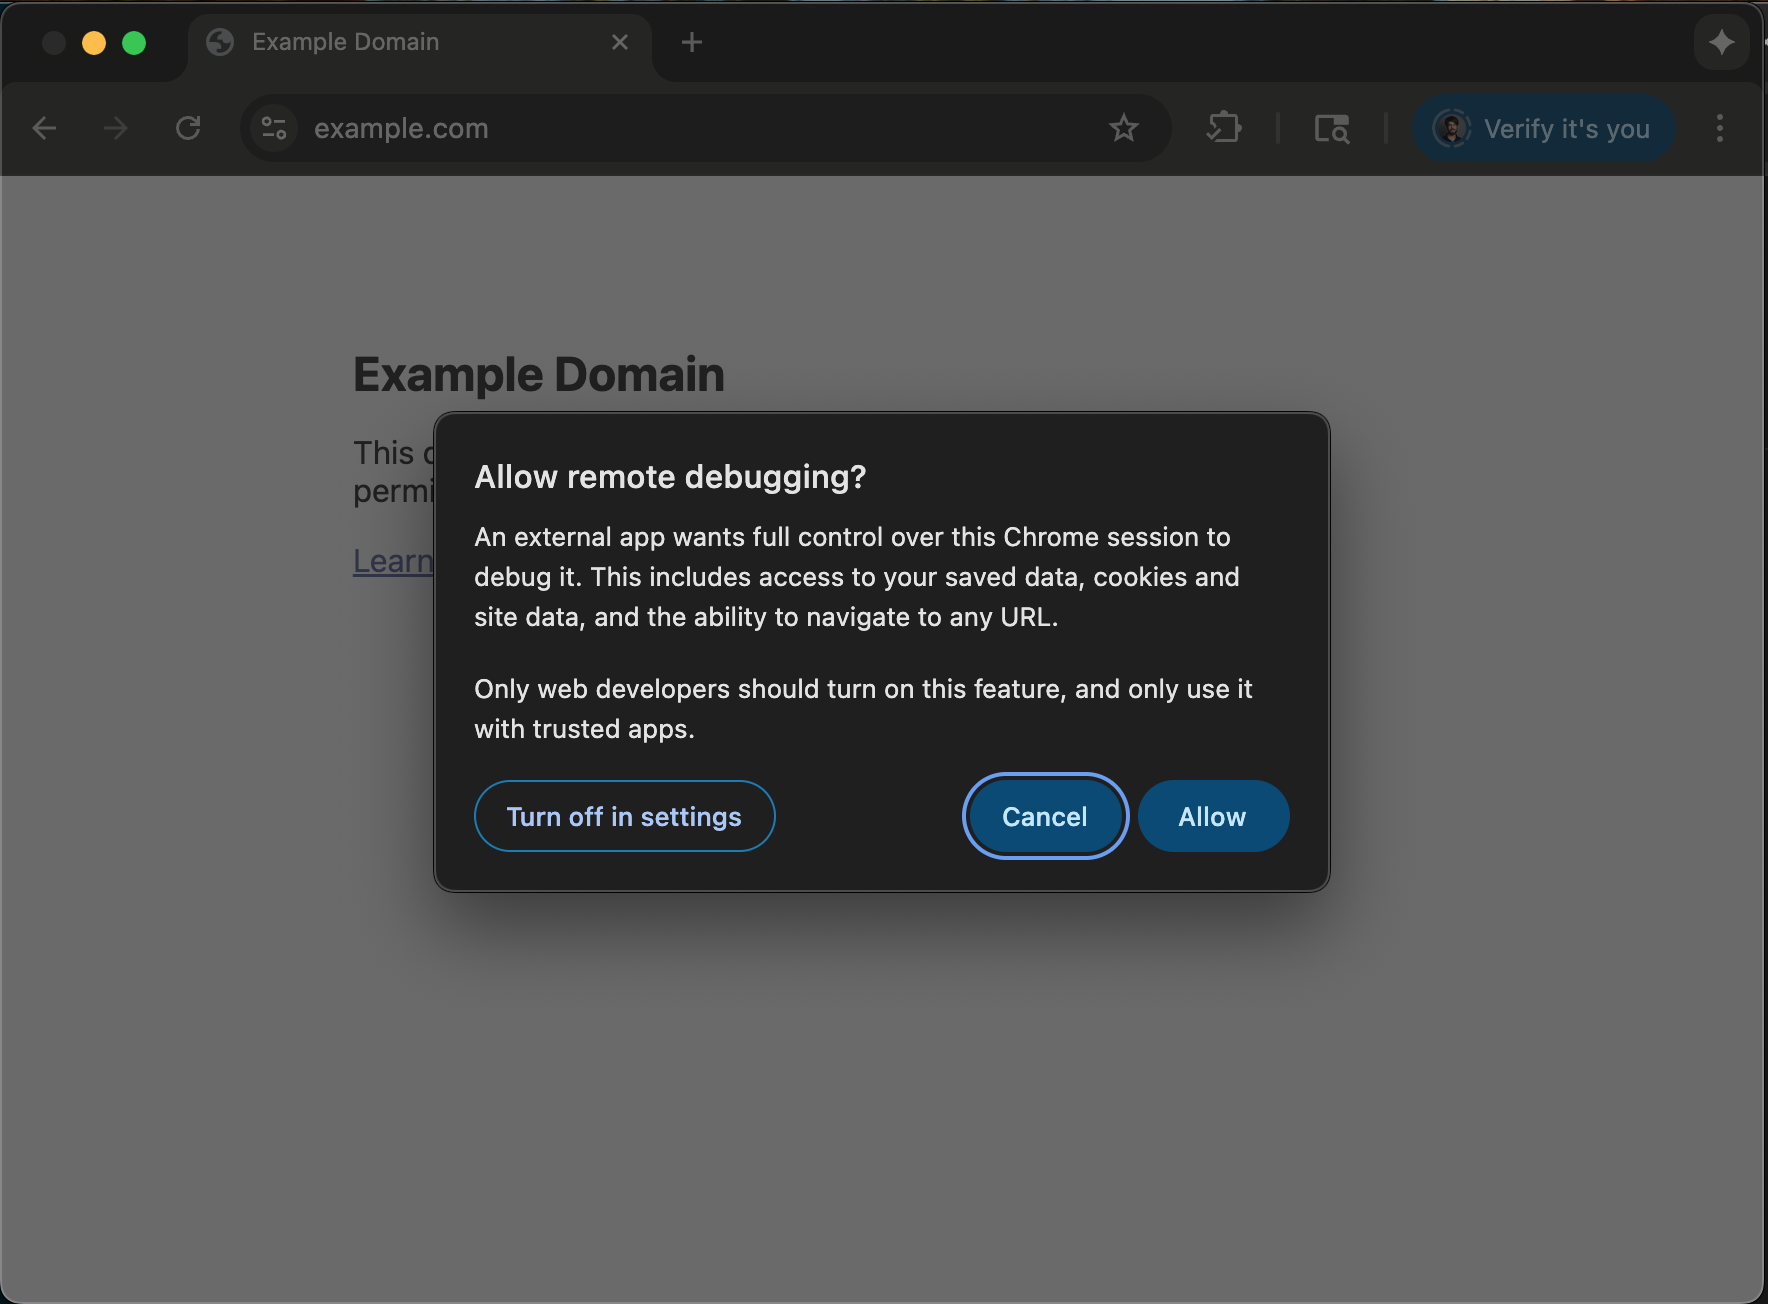
Chrome asking for user permission to start a remote debugging session.
Clicking **Allow** results in the Chrome DevTools MCP server opening [developers.chrome.com](http://developers.chrome.com/) and taking a performance trace.
For full instructions, check out the [README on GitHub](https://github.com/ChromeDevTools/chrome-devtools-mcp/?tab=readme-ov-file#chrome-devtools-mcp).
## Let your coding agent take over your debugging session
Being able to connect to a live Chrome instance means you don't have to choose between automation and manual control. You can use DevTools yourself or hand over a debugging task to your coding agent. If you discover a problem on your website, you can open DevTools to take a look to identify the element that's causing the issue. If you want your coding agent to fix the issue, you can now do so with Chrome DevTools MCP Server. You can select the element in the Elements panel and ask the coding agent to investigate the issue.
The same also works for the Network panel. You can select a network request and ask your coding agent to investigate it.
But this is just a first step. We plan to incrementally expose more and more panel data to coding agents through the Chrome DevTools MCP Server. Stay tuned!
Was this helpful?
Except as otherwise noted, the content of this page is licensed under the [Creative Commons Attribution 4.0 License](https://creativecommons.org/licenses/by/4.0/), and code samples are licensed under the [Apache 2.0 License](https://www.apache.org/licenses/LICENSE-2.0). For details, see the [Google Developers Site Policies](https://developers.google.com/site-policies). Java is a registered trademark of Oracle and/or its affiliates.
Last updated 2025-12-16 UTC.
[[["Easy to understand","easyToUnderstand","thumb-up"],["Solved my problem","solvedMyProblem","thumb-up"],["Other","otherUp","thumb-up"]],[["Missing the information I need","missingTheInformationINeed","thumb-down"],["Too complicated / too many steps","tooComplicatedTooManySteps","thumb-down"],["Out of date","outOfDate","thumb-down"],["Samples / code issue","samplesCodeIssue","thumb-down"],["Other","otherDown","thumb-down"]],["Last updated 2025-12-16 UTC."],[],[]]
* ### Contribute
* [File a bug](https://issuetracker.google.com/issues/new?component=1400036&template=1897236)
* [See open issues](https://issuetracker.google.com/issues?q=status:open%20componentid:1400036&s=created_time:desc)
* ### Related content
* [Chromium updates](https://blog.chromium.org/)
* [Case studies](https://developer.chrome.com/case-studies)
* [Archive](https://developer.chrome.com/deprecated)
* [Podcasts & shows](https://web.dev/shows)
* ### Follow
* [@ChromiumDev on X](https://twitter.com/ChromiumDev)
* [YouTube](https://www.youtube.com/user/ChromeDevelopers)
* [Chrome for Developers on LinkedIn](https://www.linkedin.com/showcase/chrome-for-developers)
* [RSS](https://developer.chrome.com/static/blog/feed.xml)
* [Terms](https://policies.google.com/terms)
* [Privacy](https://policies.google.com/privacy)
* [Manage cookies](https://developer.chrome.com/blog/chrome-devtools-mcp-debug-your-browser-session#)
* [English](https://developer.chrome.com/blog/chrome-devtools-mcp-debug-your-browser-session)
* [Deutsch](https://developer.chrome.com/blog/chrome-devtools-mcp-debug-your-browser-session?hl=de)
* [Español – América Latina](https://developer.chrome.com/blog/chrome-devtools-mcp-debug-your-browser-session?hl=es-419)
* [Français](https://developer.chrome.com/blog/chrome-devtools-mcp-debug-your-browser-session?hl=fr)
* [Indonesia](https://developer.chrome.com/blog/chrome-devtools-mcp-debug-your-browser-session?hl=id)
* [Italiano](https://developer.chrome.com/blog/chrome-devtools-mcp-debug-your-browser-session?hl=it)
* [Nederlands](https://developer.chrome.com/blog/chrome-devtools-mcp-debug-your-browser-session?hl=nl)
* [Polski](https://developer.chrome.com/blog/chrome-devtools-mcp-debug-your-browser-session?hl=pl)
* [Português – Brasil](https://developer.chrome.com/blog/chrome-devtools-mcp-debug-your-browser-session?hl=pt-br)
* [Tiếng Việt](https://developer.chrome.com/blog/chrome-devtools-mcp-debug-your-browser-session?hl=vi)
* [Türkçe](https://developer.chrome.com/blog/chrome-devtools-mcp-debug-your-browser-session?hl=tr)
* [Русский](https://developer.chrome.com/blog/chrome-devtools-mcp-debug-your-browser-session?hl=ru)
* [עברית](https://developer.chrome.com/blog/chrome-devtools-mcp-debug-your-browser-session?hl=he)
* [العربيّة](https://developer.chrome.com/blog/chrome-devtools-mcp-debug-your-browser-session?hl=ar)
* [فارسی](https://developer.chrome.com/blog/chrome-devtools-mcp-debug-your-browser-session?hl=fa)
* [हिंदी](https://developer.chrome.com/blog/chrome-devtools-mcp-debug-your-browser-session?hl=hi)
* [বাংলা](https://developer.chrome.com/blog/chrome-devtools-mcp-debug-your-browser-session?hl=bn)
* [ภาษาไทย](https://developer.chrome.com/blog/chrome-devtools-mcp-debug-your-browser-session?hl=th)
* [中文 – 简体](https://developer.chrome.com/blog/chrome-devtools-mcp-debug-your-browser-session?hl=zh-cn)
* [中文 – 繁體](https://developer.chrome.com/blog/chrome-devtools-mcp-debug-your-browser-session?hl=zh-tw)
* [日本語](https://developer.chrome.com/blog/chrome-devtools-mcp-debug-your-browser-session?hl=ja)
* [한국어](https://developer.chrome.com/blog/chrome-devtools-mcp-debug-your-browser-session?hl=ko)